

Your Fund’s Tax-Cost Ratio: The Hidden Number That Can Quietly Wreck Your Retirement
By Dan Gould | Three Streams Financial
Independent, Fee-Only Fiduciary Advisor
A client came to me last year holding several actively managed funds she had purchased over the years. Although these funds had performed reasonably well, I noticed they had extremely high tax-cost ratios and were very tax-inefficient. Nearly two decades of embedded capital gains meant that selling them would trigger a massive tax bill, leaving her stuck with these tax-inefficient funds and unable to move without incurring a painful tax hit.
Do you know what your fund’s true costs are?
Most investors know their fund’s expense ratio down to the decimal point. Few have ever heard of its tax-cost ratio. That single number can matter more than the expense ratio, especially inside a taxable account meant to fund retirement.
Quick answer: A fund’s tax-cost ratio measures how much of its annualized return is lost to taxes on distributed dividends, interest, and capital gains. Morningstar publishes this figure for every fund alongside its expense ratio — a ratio near 0% is highly tax-efficient, while 5% or higher signals a fund that is extremely tax-inefficient. Actively managed, high-turnover funds often run 1.5 to 2 percentage points higher than tax-managed index funds, which on a $500,000 portfolio over 20 years can mean a difference of more than $600,000 — from taxes alone, not fees.
This post will discuss:
- What a fund’s tax-cost ratio actually measures
- Why a high ratio can quietly erase years of retirement growth
- How my client got locked into an expensive, tax-inefficient fund
- How to find and compare a fund’s tax-cost ratio before you invest
- Why the 3-year number isn’t the whole story, and what Potential Capital Gains Exposure reveals
- Why Vanguard’s tax-managed funds are worth a look
Do you know what your fund’s true costs are? Let’s find out.
What Is a Fund’s Tax-Cost Ratio, and Why It’s Overlooked
Morningstar created the tax-cost ratio to measure something expense ratios miss entirely. It shows how much a fund’s annualized return is reduced by taxes on distributions. Mutual funds must distribute dividends, interest, and realized capital gains to shareholders every year. Investors owe tax on those distributions, even if they never sold a single share.
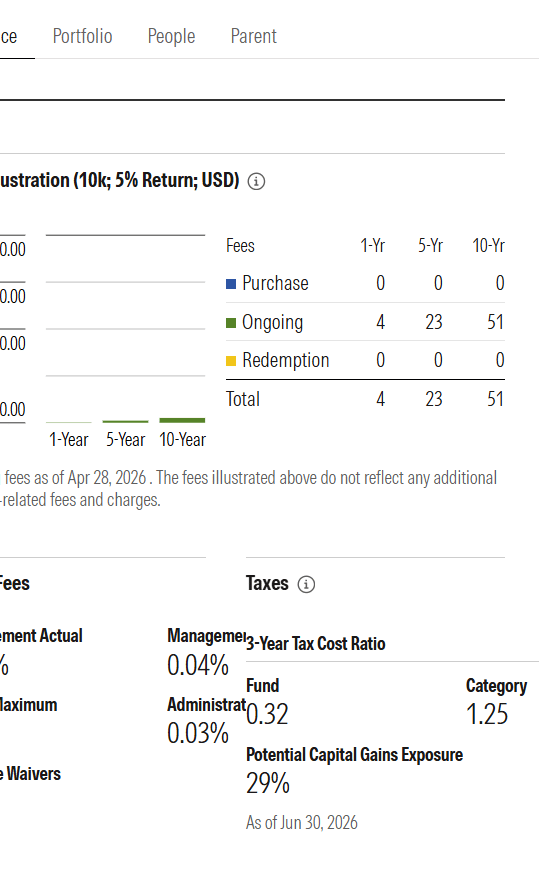
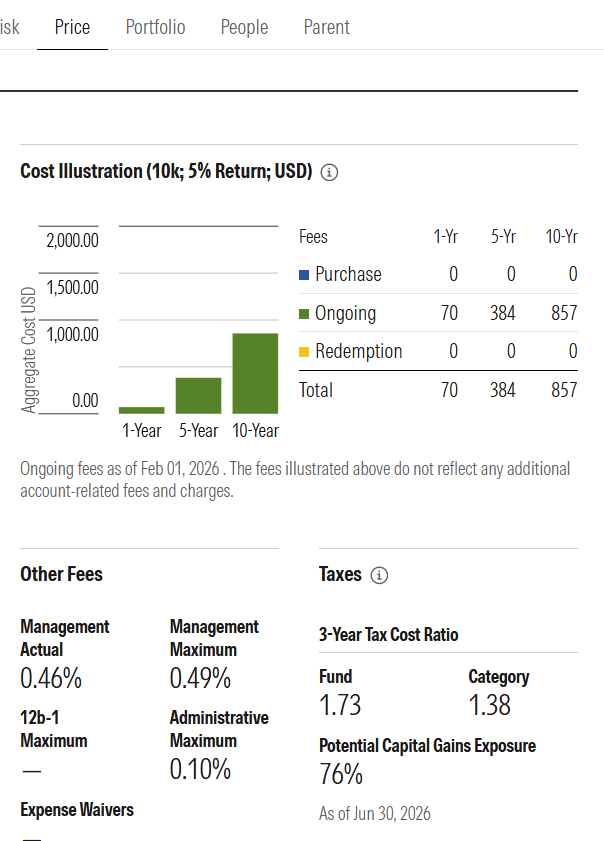
Think of it like a tax expense ratio. A fund with a 2% tax cost ratio and a 10% pretax return effectively yields an 8% after-tax return. The ratio typically ranges from 0% to 5%. A tax-cost ratio of zero means a fund has not made any taxable distributions, while a ratio of 5% or higher signals that the fund is extremely tax-inefficient. For example, Morningstar’s “Price” tab for each fund provides a clear look at these ratios. One fund, on the left, shows a 3-year tax-cost ratio of just 0.32. In contrast, the less efficient fund on the right has a tax-cost ratio of 1.73—more than five times higher. (see examples below)
According to AAII, actively managed stock funds have grown less tax-efficient over time, not more, largely due to rising turnover. Index funds and ETFs tend to score far lower on this measure because they trade less often. That’s one reason we favor owning individual stocks or taking a dividend-growth investing approach, which naturally holds high-quality companies for years rather than trading in and out.
Why a High Tax-Cost Ratio Can Quietly Wreck a 20-Year Retirement Plan
The damage rarely shows up in a single year. It compounds silently, for decades, until it’s enormous.
Consider two funds, each earning an 8% pretax annual return over 20 years. Fund A carries a tax-managed 0.20% tax-cost ratio, common among tax-efficient index funds. Fund B carries a 2.0% tax-cost ratio, typical of a high-turnover active fund. That gap isn’t unusual. Morningstar data shows mutual funds have averaged close to 1.90% in annual tax drag over the past decade, versus roughly 0.70% for equity ETFs.
On a $500,000 investment, Fund A grows to roughly $2.25 million after 20 years. Fund B, weighed down by taxes, grows to only about $1.6 million. That’s a difference of more than $600,000 from tax drag alone. Fees didn’t cause that gap. Taxes did.

For a retirement account, that gap can mean retiring years later than planned. It can also mean permanently lower withdrawals throughout retirement. If you already feel behind on retirement savings, an overlooked tax-cost ratio can make that gap even harder to close.
A Client’s Story: Locked Into High-Cost Funds for Years
My client’s funds weren’t just tax-inefficient going forward. They carried years of embedded gains from her original purchases — exactly the risk measured by what analysts call Potential Capital Gains Exposure. Selling meant realizing all of that built-up gain at once, in a single tax year.
This is the trap I see most often. Investors buy an actively managed fund, watch its tax-cost ratio climb for years, then feel stuck. Selling triggers a tax bill large enough to offset years of savings from switching to something cheaper.
We’re still in the process of unwinding her positions, selling off shares gradually, and using losses from other investments to help offset the gains. The process has already taken two tax years, and we’re not quite finished yet. Had she checked the fund’s tax-cost ratio back in 2007, she could have avoided this tax trap altogether. This is exactly the kind of ongoing, best-interest analysis a fee-only fiduciary is built to catch — a commissioned broker has no incentive to flag a fund that’s already generating them a trail commission.
How to Find and Compare a Fund’s Tax-Cost Ratio
Checking a fund’s tax-cost ratio takes minutes, and it’s free.
Morningstar lists a fund’s tax-cost ratio directly on its report page, next to its expense ratio. AAII members can find the same figure on a fund’s Evaluator page and in AAII’s Mutual Fund and ETF Guides. Just search by ticker symbol on either site.
Compare the ratio across the 3-year, 5-year, and 10-year periods. A fund with a low three-year ratio can still carry a much higher 10-year figure. Look at the number and the trend over time. Then compare it to a similar index fund in the same category. If the gap is a full percentage point or more, ask why. High portfolio turnover is usually the answer. Here are two examples from Morningstar:
Check the 3-Year Ratio, But Don’t Stop There: Potential Capital Gains Exposure
Most investors who bother to check a tax-cost ratio only glance at the trailing three-year figure. That number only counts gains a fund has already distributed and taxed. It says nothing about what’s still sitting inside the fund, waiting to come out.
Morningstar tracks a separate, related metric for that risk: Potential Capital Gains Exposure, or PCGE. PCGE estimates the percentage of a fund’s total assets that represent unrealized or undistributed gains within the portfolio.
A fund showing a PCGE of 35% has more than a third of its assets tied up in embedded gains. Whenever the manager eventually sells those winners, every shareholder gets a taxable distribution. Even brand-new investors who bought in last month can owe tax on gains earned years before they ever invested. (See the two examples above)
This is exactly the mechanism that trapped my client. Her fund’s three-year tax-cost ratio looked tame in some years. But its PCGE had quietly climbed past 40% after nearly two decades of untouched gains from her original 2007 purchase.
Before buying an older, successful active fund, check both numbers. Use the 3-year, 5-year, and 10-year tax-cost ratios for what’s already happened. Use PCGE for what’s still baked in and could hit your tax bill later.
A high PCGE alone isn’t automatically a red flag. A genuine long-term, low-turnover holding can carry a high PCGE for years without a distribution. But paired with a rising historical tax-cost ratio, it signals real risk of an unpleasant tax surprise down the road.
Tax-Managed Funds: A Smarter Option for Taxable Money
Not every fund family manages taxes with the same discipline. Vanguard built its Tax-Managed fund lineup specifically to keep tax costs low.
Vanguard’s Tax-Managed Capital Appreciation Fund, for example, is index-based and has an expense ratio of about 0.05%. It’s built to limit taxable distributions year after year. That combination of low fees and low tax drag compounds meaningfully over 20 years.
We don’t recommend blindly chasing any single fund. But when placing equity holdings inside a taxable brokerage account, tax-managed or index-based options deserve real consideration. Pairing that decision with quality, low-turnover holdings can further reduce unnecessary tax drag — see how we approach this in our post on diversifying investment strategies to reduce risk.
What to Do When You Find a High Tax-Cost Ratio
Ideally, you want to avoid this situation altogether. However, if you cannot, consider the following professional steps:
First, review your portfolio and evaluate the tax-cost ratios of your current funds.
Second, assess the placement of each fund. Tax-inefficient, high-turnover funds are generally more suitable for IRAs or 401(k)s rather than taxable accounts — which ties directly into how you sequence withdrawals across account types in retirement.
Third, if you have significant embedded gains, avoid selling all at once. Instead, plan a gradual, multi-year exit strategy combined with loss harvesting to minimize taxes.
Finally, partner with a fee-only advisor who acts in your best interest and is not incentivized to retain you in costly, tax-inefficient funds.
In Conclusion: Know Your Fund’s True Costs
A fund’s expense ratio tells only part of the story. Its tax-cost ratio and its Potential Capital Gains Exposure can matter just as much, sometimes more, especially over 20 years in a taxable account.
Do you know what your fund’s true costs are? Most investors don’t, until it’s too late to fix cheaply.
At Three Streams Financial, we review a client’s full fund lineup for hidden tax drag, not just headline fees. Combined with the tax deductions and dividend benefits available to retirees, minimizing your tax-cost ratio is one of the simplest ways to keep more of what you earn.
Frequently Asked Questions
What is a good tax-cost ratio for a mutual fund?
A tax-cost ratio close to 0% is considered highly tax-efficient, while a ratio of 1% or below is generally reasonable for an actively managed fund held in a taxable account. A ratio of 2% or higher is a warning sign, and 5% or more signals a fund that is extremely tax-inefficient.
Where can I find a fund’s tax-cost ratio?
Morningstar publishes a fund’s tax-cost ratio directly on its report page, next to the expense ratio, under the fund’s “Price” tab. AAII members can find the same figure on a fund’s Evaluator page and in AAII’s Mutual Fund and ETF Guides. Both are searchable by ticker symbol.
What is Potential Capital Gains Exposure (PCGE), and why does it matter?
PCGE estimates the percentage of a fund’s total assets that represent unrealized or undistributed gains sitting inside the portfolio. A high PCGE means a large taxable distribution could hit shareholders whenever the fund manager eventually sells those winning positions, even for investors who bought in recently.
Do index funds have lower tax-cost ratios than actively managed funds?
Generally, yes. Index funds and ETFs tend to trade less often than actively managed funds, which results in fewer taxable distributions. Morningstar data shows mutual funds have averaged close to 1.90% in annual tax drag over the past decade, compared to roughly 0.70% for equity ETFs.
Key Takeaways
- A fund’s tax-cost ratio shows how much annual return is lost to taxes on distributions, similar to an expense ratio
- Active, high-turnover funds often carry tax-cost ratios 1.5 to 2 percentage points higher than tax-managed index funds
- Over 20 years, that gap alone can cost a $500,000 portfolio more than $600,000 in growth
- The trailing 3-year tax-cost ratio only shows past distributions; check Potential Capital Gains Exposure (PCGE) to see gains still embedded and waiting to be taxed
- Check a fund’s Morningstar or AAII page before buying, and again before embedded gains lock you in
Fee-Only Advice. Proven Process. Transparent Planning.
Remember, there’s no one-size-fits-all approach to investing. Conduct thorough research, consider your personal circumstances, and consult a fee-only financial advisor before making any investment decisions.
P.S. Want to see exactly where you stand? I’ve created a free Personalized Retirement Map that addresses all four critical areas: Income, Investments, Planning, and Legacy. No pitch, just clarity.

Related Reading
See how a rising, tax-efficient income stream fits into a broader retirement plan in The Magic of Dividend Growth Investing: How to Outpace Inflation in 2026, and read more on withdrawal order in How to Pay Less Tax in Retirement. Learn more about our investment management approach, or get in touch to have your own fund lineup reviewed for hidden tax drag.

Hello, I’m Dan Gould, an independent fee-only advisor based in Overland Park, KS. I offer comprehensive financial services to individuals, families, professionals, and small business owners nationwide. With over 25 years of experience in institutional financial markets, I deliver proven portfolio management and retirement income strategies.