
Case Study: A $170,900-a-Year Retirement Plan — What Happens If the Market Underperforms for 15 Years
By Dan Gould | Three Streams Financial — Independent, Fee-Only Fiduciary Advisor
Client profile: Doug, 50, a business owner comfortable with a 60% equity / 40% bond risk profile. Names and identifying details have been changed for privacy — see compliance note at the end.
A worry we hear from clients in their 50s: “What if the market just doesn’t deliver the way it has historically over the next 15 years?” Doug had exactly that concern. He’s comfortable with his 60/40 risk profile, but he’s watched enough market history — the 2000s, Japan’s multi-decade stretch — to know stocks can go through long periods of subpar returns. He wanted a plan for age 65 that still held up if the next 15 years were mediocre for equities, not the historical average. This case study walks through the plan we built, using a modest, below-average 3.5% annual stock return assumption—and shows the drastic difference between a dividend-growth approach and the plain total-return portfolio most people default to when the market underperforms.
Note: Names and details below are illustrative and generalized to protect privacy. Figures are planning assumptions, not guarantees. See disclosures at the end.
The Setup: A $1,000,000 Portfolio, Split Three Ways
Doug came to us at 50 with $1,000,000 saved across his retirement accounts, comfortable with a 60% stock / 40% bond risk profile. His goal: retire at 65 with enough income to fully replace his working income, without being forced to sell shares to fund his lifestyle — especially in a stretch of years where the market simply doesn’t cooperate.
We split his $1,000,000 into three pieces:
- Social Security — claimed at 65
- A dedicated dividend growth portfolio — $500,000, carved out of his 60% equity allocation, built to pay a growing stream of dividend income regardless of how the broader market performs
- His 40% bond allocation — $400,000, generating interest income at a 4.5% yield
That leaves $100,000 as a flexible reserve for rebalancing or unplanned expenses.
Doug is also a business owner, which gives him a lever most W-2 employees his age don’t have: he can defer $17,000 a year into a SIMPLE IRA, plus a $4,000 catch-up contribution available to savers 50 and older — for a total of $21,000 a year. Rather than concentrating that in one place, we split it evenly: $10,500/year into the dividend growth portfolio, and $10,500/year into the bond allocation, keeping his risk profile somewhat balanced as the accounts grow.
The Numbers: A Below-Average Market, Modeled Honestly
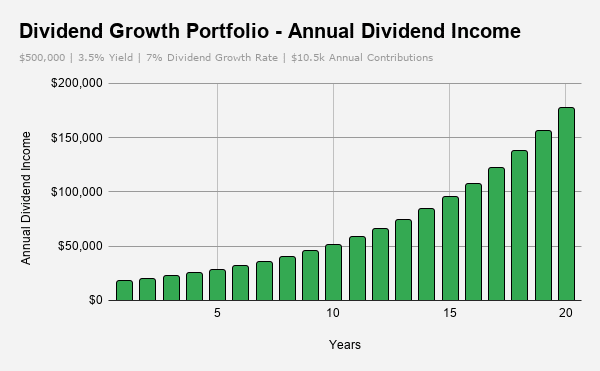
To stress-test Doug’s worry, we modeled his dividend-growth portfolio assuming the stock market delivers just 3.5% annual price appreciation over the next 15 years — well below the long-run historical average and roughly the kind of subpar stretch Doug was worried about. On top of that modest price return, we assumed a 3.5% starting dividend yield, with the dividend itself growing 7% a year, which is roughly in line with the long-run dividend growth rate of high-quality companies and hasn’t historically required a strong stock market to sustain.
| Age | Dividend Portfolio Value | Yearly Dividend Income |
|---|---|---|
| 50 (start) | $500,000 | $17,500 |
| 55 | $770,200 | $28,300 |
| 60 | $1,189,300 | $51,400 |
| 65 (retirement) | $1,869,000 | $95,000 |
Even with the stock market underperforming its historical norms for a decade and a half, Doug’s dividend income climbs from $17,500 to $95,000 a year — because the income is driven by what the underlying companies pay out in cash, not by how richly (or poorly) the market prices their shares. That’s the whole point of building an income plan around dividend growth rather than around market appreciation.
His bond allocation compounds independently of what the stock market does:
| Age | Bond Portfolio Value | Yearly Interest Income |
|---|---|---|
| 50 (start) | $400,000 | $18,000 |
| 55 | $556,000 | $25,000 |
| 60 | $750,000 | $32,600 |
| 65 (retirement) | $992,000 | $42,300 |
These are planning assumptions, not guarantees — we’re using 4.5% for interest income, roughly where the 10-year yield is today.
LEARN MORE AT OUR FREE DIVIDEND GROWTH WORKSHOP COMING UP SOON – CLICK HERE!
The Payoff: About $170,900 a Year, Even in a Sluggish Market
Here’s how the three streams combine at age 65:
| Income Source | Annual Amount |
|---|---|
| Dividend Growth Portfolio Income | $95,000 |
| Bond Interest | $42,300 |
| Social Security (Illustrative Estimate) | $33,600 |
| Total Income | $170,900 |
A note on that Social Security figure: it’s an illustrative estimate for a moderate-to-higher earner claiming at 65, not Doug’s actual Primary Insurance Amount. The real number depends on his specific earnings history and full retirement age, and should be confirmed with an actual Social Security statement before finalizing any plan.
Just as important as the total is what Doug doesn’t have to do to get it: sell equities to fund his lifestyle. The full $1,869,000 dividend sleeve and $992,000 bond balance are still fully intact at 65, because the income these two pieces produce, combined with Social Security, covers his target spending on its own — even after 15 years of a market that never delivered its historical average.
The Drastic Difference: Dividend Growth vs. the Total-Return Portfolio Most People Default To
Here’s the question that matters most for anyone sharing Doug’s worry: “If the market really does underperform for the next 15 years, how much does your retirement plan actually suffer — and does it matter what kind of stock portfolio you’re holding when that happens?“
Most investors default to a total-return portfolio — a broad index fund or similar holding, where the return shows up almost entirely as a rising (or, in a bad stretch, barely rising) account balance rather than as a stream of cash. We ran the same underperforming-market scenario — 3.5% annual return, nothing better — through a total-return portfolio: same $500,000 starting balance, same $10,500/year contribution, but with no dividend growth mechanism of its own. Since this kind of portfolio doesn’t generate meaningful income on its own, funding retirement from it means selling shares every year — the same mechanism behind the traditional “safe withdrawal rate” approach we’ve written about before.
| Metric |
Total-Return Portfolio (3.5%/yr, underperforming market) |
Dividend Growth Portfolio (same 3.5% market, 7% dividend growth) |
|---|---|---|
| Portfolio Value at 65 | $1,040,300 | $1,869,000 |
| Annual Income at 65 |
~$41,600 (via a 4% withdrawal) |
$95,000 (dividend income only) |
| Requires Selling Shares? | Yes, every year | No — none |
Adding in the bond sleeve and Social Security, which are identical in both scenarios:
| Income Component | Total-Return Approach | Dividend Growth Approach |
|---|---|---|
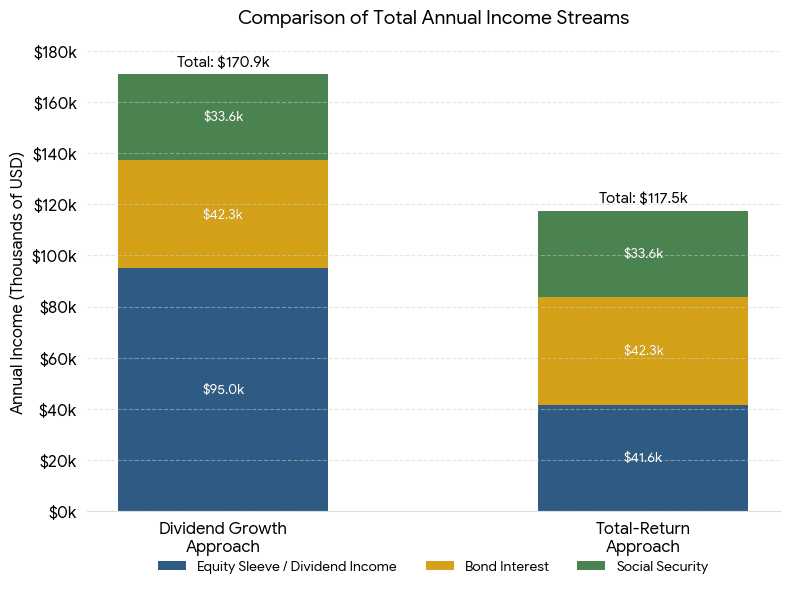
| Equity sleeve income | $41,600 | $95,000 |
| Bond interest | $42,300 | $42,300 |
| Social Security | $33,600 | $33,600 |
| Total annual income | ~$117,500 | ~$170,900 |
| Requires selling equities for income? | Yes | No |
Consequently, that’s roughly a $53,400/year gap — more than 45% more income — in favor of the dividend growth approach, even in the underperforming-market scenario Doug feared. Furthermore, the gap goes beyond just the dollar amount. With the total-return portfolio, Doug must sell about 4% of his holdings every year to generate income, even when the market is down or flat. This process introduces “sequence-of-returns risk,” which has steadily driven safe withdrawal rate estimates lower in recent years. In contrast, the dividend growth portfolio avoids selling altogether — the income arrives as cash each year, regardless of whether the market is up, flat, or down.
However, one honest caveat remains: this comparison assumes dividend growers deliver a somewhat higher total return than a generic total-return portfolio earning the same 3.5%. Specifically, the combination of 3.5% price growth plus a compounding, growing dividend yield tends to outpace a flat 3.5% total return over time. In fact, this is a reasonable, historically grounded assumption for a well-constructed portfolio of high-quality, durable dividend growers (hint: Dividend Aristocrats). Nevertheless, it is important to remember this is an assumption, not a guarantee. The advantage shown here comes from (1) the somewhat steadier fundamentals typical of long-time dividend growers, and (2) not needing to sell into an underperforming market to generate income – not from a hidden mathematical trick.
What If Doug Waits a Few More Years?
Waiting even one or two extra years compounds quickly here — both because the dividend sleeve’s rising current yield keeps accelerating, and because the underlying portfolio keeps growing on an ever-larger base. This assumes dividends keep growing 7%/year and the market continues at its assumed 3.5%/year for the full 18 years — the same underperforming scenario carried forward, not an optimistic one.
As we look to the future, we can add even greater value by implementing advanced strategies. For example, we can pursue Roth conversions, optimize Social Security timing to maximize lifetime income, and design a comprehensive withdrawal plan to minimize potential IRMAA surcharges. Ultimately, these proactive steps help secure your financial future.
Five takeaways if you share Doug’s worry about future market performance:
- A subpar stock market doesn’t have to mean subpar retirement income. Strong company cash flow and proactive payout policies drive dividend growth. Historically, companies have continued to increase dividends even during prolonged periods of weak market returns.
- Against a plain total-return portfolio facing the same underperforming market, dividend growth wins decisively — on income and on risk. Roughly $53,400/year more in income, and none of it requires selling shares into a sluggish market.
- The total-return approach most investors default to is the one most exposed to a bad 15-year stretch. Without a growing income stream of its own, it has no choice but to sell shares for cash every year, no matter what the market is doing.
- Splitting new savings between stocks and bonds keeps the plan balanced. Directing $10,500/year to each sleeve, rather than concentrating all $21,000 in one, keeps Doug closer to his comfortable risk profile as the accounts grow.
- Business owners have an extra savings lever — use it. Doug’s $21,000/year SIMPLE IRA deferral plus catch-up, split evenly and reinvested consistently, meaningfully strengthens the plan against exactly the market environment he was worried about.
If Doug’s worry sounds like yours — a solid nest egg, but real concern about a market that underperforms for the next decade or more — we’d be glad to run these numbers against your own accounts. Join our Dividend Growth Investing Workshop, or read why we work on a fee-only basis before you reach out.
Learn more about dividend growth investing:
- https://threestreamsfinancial.com/conservative-investor-growth-lower-volatility-equities/
- https://threestreamsfinancial.com/how-growing-dividends-can-raise-your-safe-withdrawal-rate-in-retirement/
Fee-Only Advice. Proven Process. Transparent Planning.
Remember, there’s no one-size-fits-all approach to investing. Conduct thorough research, consider your personal circumstances, and consult a fee-only financial advisor before making any investment decisions. Past performance is not indicative of future results.
P.S. Want to see how your own portfolio — and your own business’s retirement plan options — would hold up if the market underperforms for a while? I’ve created a free Personalized Retirement Map that addresses all four critical areas: Income, Investments, Planning, and Legacy. No pitch, just clarity. → Get Your Free Personalized Retirement Map
Disclosures: This is a hypothetical, illustrative example for educational purposes — not an actual client, and not a guarantee of results. The portfolio values, contribution amounts, yields, and withdrawal rates presented here are hypothetical and for illustrative purposes only. Actual investment returns, contribution limits, and safe withdrawal rates will vary based on market conditions, individual circumstances, and changing regulations. Figures are not guarantees of future results or personalized advice. Actual returns, dividend growth, and share prices will fluctuate, and both dividend growth investing and total-return investing carry risk, including possible dividend cuts, dividend freezes, and loss of principal.
The bond allocation assumes a flat 4.5% yield with interest reinvested annually rather than withdrawn prior to retirement; actual bond yields and values will vary with interest rates and credit conditions. The Social Security figure is an illustrative estimate only and is not based on any individual’s actual earnings record; actual benefits depend on personal work history, claiming age, and current program rules. This is not personalized investment, tax, or Social Security advice. Three Streams Financial LLC is a fee-only registered investment adviser — see our Form ADV for details.
Related Reading
Compare this to our other case study, A $150,000-a-Year Retirement Income Plan by 62, and read more about the strategy behind both in Dividend Growth Investing in 2026. Learn more about our retirement income planning process, or get in touch to build a plan of your own.

Hello, I’m Dan Gould, an independent fee-only advisor based in Overland Park, KS. I offer comprehensive financial services to individuals, families, professionals, and small business owners nationwide. With over 25 years of experience in institutional financial markets, I deliver proven portfolio management and retirement income strategies.